ملخص
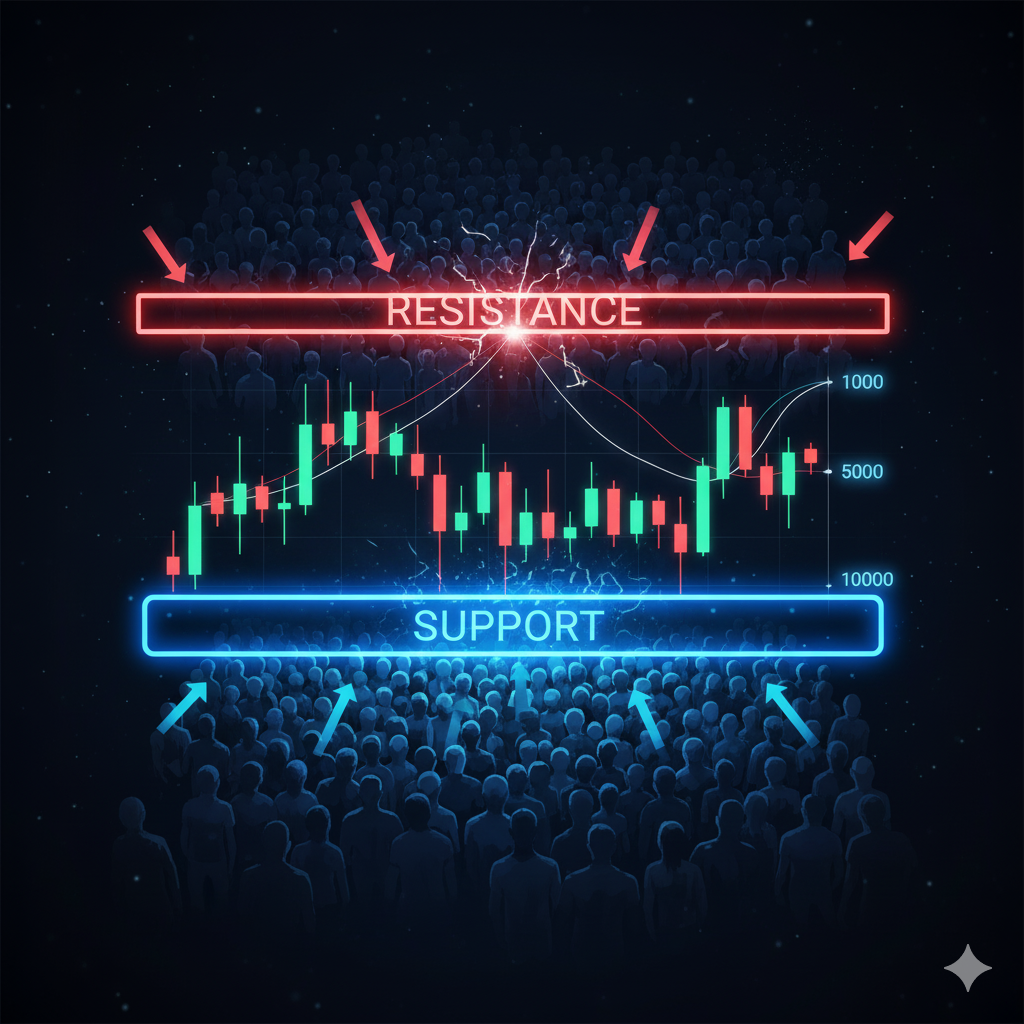
لا يوجد مفهوم أكثر تداولًا بين المحللين الفنيين من الدعم والمقاومة. هي ليست مجرد خطوط أفقية على الرسم البياني، بل انعكاس حقيقي لتوازن قوى العرض والطلب
كل سوق مالي – سواء أسهم، عملات، سلع – يتحرك ضمن مستويات دعم ومقاومة. هذه المستويات ليست خطوطًا اعتباطية، بل مناطق يتجمع عندها العرض والطلب وتتشكل حولها قرارات الملايين من المستثمرين.
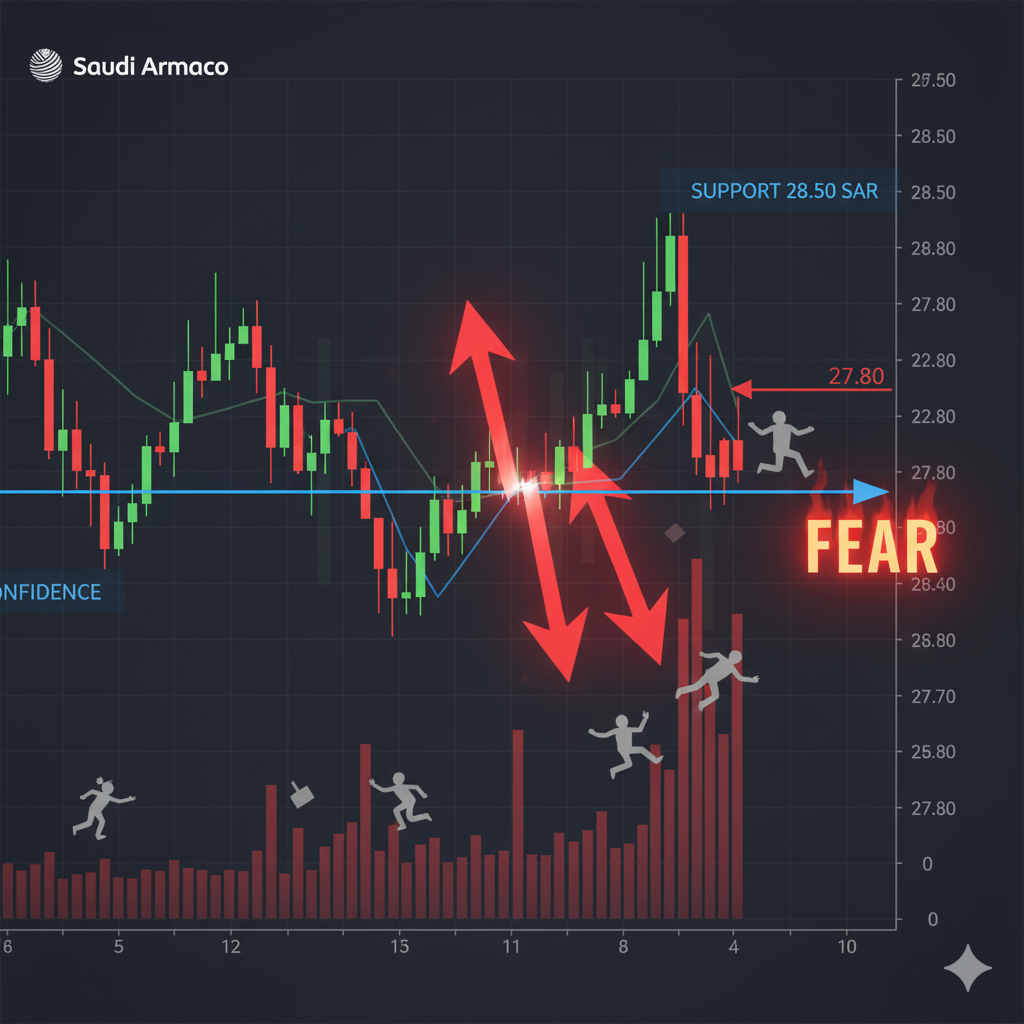
1. تعريف الدعم والمقاومة الدعم: مستوى يُتوقع عنده أن يزداد الطلب بما يكفي لإيقاف الهبوط. المقاومة: مستوى يُتوقع عنده أن يزداد العرض بما يكفي لإيقاف الصعود.
2. الخلفية النفسية المستثمرون الذين اشتروا عند الدعم سابقًا سيدافعون عنه. المستثمرون الذين علقوا عند المقاومة سيبيعون عند عودتها للتعادل. "الذاكرة الجماعية" تجعل هذه المستويات متكررة.
3. أنواع الدعم والمقاومة الأفقية: مستويات تاريخية ثابتة. الديناميكية: عبر خطوط الاتجاه. المتحركة: عبر المتوسطات. النفسية: أرقام مستديرة. المركبة: خليط بين أكثر من نوع.
4. كيف تتكون هذه المستويات؟ بسبب أحداث سابقة: مثل أخبار أو أرباح. بسبب العوامل الفنية: مثل المتوسطات أو نماذج الشموع. بسبب العوامل النفسية: ميل الناس للأرقام "الكبيرة".
5. استراتيجيات التداول باستخدامها الشراء عند الدعم / البيع عند المقاومة. كسر الدعم أو المقاومة = بداية اتجاه جديد. الدور العكسي (الدعم يتحول مقاومة والعكس).
6. الأخطاء الشائعة رسم مستويات كثيرة جدًا. تجاهل حجم التداول. الاعتقاد بأن الدعم/المقاومة أبدية.
🔹 الخلاصة: الدعم والمقاومة هما حجر الأساس للتحليل الفني، وكل أداة أخرى تقريبًا تعتمد عليهما.
المقالات الأخيرة

📊الأسهم الصغيرة والمتوسطة تقود أحجام ال...
يوليو 06, 2026
الصكوك والسندات: متى تكون بديلًا مناسبًا...
يونيو 30, 2026
القطاع المصرفي يقود سيولة السوق السعودي....
يونيو 30, 2026
تاسي ينهي الأسبوع على تراجع 1.69% وسط هب...
يونيو 25, 2026